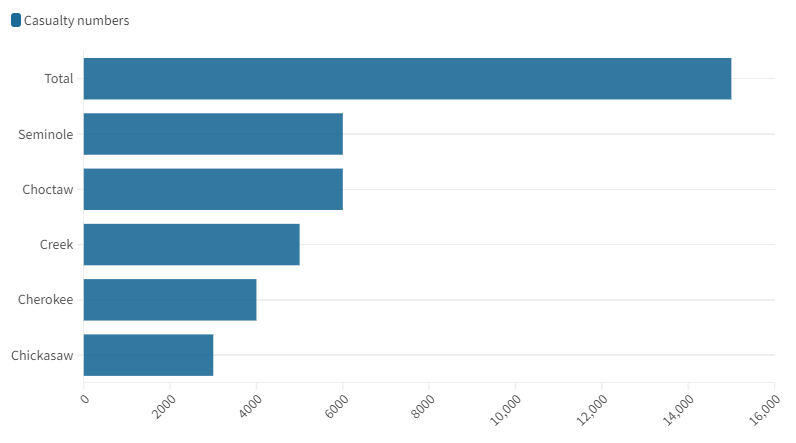
When working on the Data chart for Flourish, I honestly had trouble deciding what to discuss until I settled on the Trail of Tears. Even then, I had some difficulty putting it together due to a lack of clarification on the details of the assignment. I started off by listing the peoples, which I referred to as the “Civilized tribes”, since they would have been historically referred to that around the time of the Trail of Tears itself. I listed the Cherokee, Choctaw, Creek, Chickasaw and Seminole peoples and while I know that each of these peoples have different names which they called themselves, I had forgotten the names in which these peoples would refer to themselves as. I also listed the US states in which the Trail of Tears passed through. These states were comprised of Alabama, Arkansas, Georgia, Illinois, Kentucky, Oklahoma, North Carolina and Tennessee. Granted, I have several years worth of knowledge in terms of history that involves Native American peoples in general. However, either I forgot or I learned something new because I was unaware of Illinois being one of the US states to be part of the Trail of Tears. I also made a point of discussing the casualty numbers of the five peoples as part of the data.
I noticeably made two flourish data collections but only submitted one. The first data collection included the causes of death for the casualties on the Trail of Tears. Among the causes of death were starvation, typhus and even cholera. I also tried to look for the precise numbers of deaths among each of the five peoples. From what I found initially the Cherokee had 1,500 deaths, however I looked at a few more articles from communityliteracy.com and narrowed it down to 6,000 estimated deaths. I also had some notable trouble with finding exact numbers on the Creek and Seminole at first. However, I was soon able to find number estimates of around 5,000 for the Creek. As for the Seminole, I couldn’t find exact numbers for the Trail of Tears itself but about 6,000 died during the Seminole Wars. The total number of casualties along the Trail of Tears was around 15,000.
As for the strategy I used to create my model, the first time I tried a chart graph but it was rather confusing because I had no clue what to do. That was until I went to the red room in Seymour Library during their “Long Night Against Procrastination” event. Mike, one of the people at the library helped me out with understanding what the assignment was and helping me set my graph up. I’m not sure what else would work with the bar graph I used. Perhaps a few pie charts would’ve been beneficial, one that showed the states that made up the route of the Trail of Tears, another which showed the five “civilized tribes” and another pie chart showing the number of deaths for each people. There could’ve also been another pie chart which showed the causes of deaths as well. Yet, given the impression that we were only supposed to do one graph, all those pie charts would’ve seemed like overkill.
In conclusion, this was a rather difficult process but I was able to pull through it. The task of a research question was difficult to find until a few tweaks within the Trail of Tears. Then it was difficult trying to find a deeper research question along with making the right graph. However, with the help from people in the SMC library, I was able to get a better understanding of the assignment. All in all, this was a difficult assignment, but I was able to provide an answer about the Trail of Tears.